Facebook-bot behaving badly
Quick Summary: Facebookbot can be sporadically greedy, but will back-off temporarily when sent an HTTP 429 (Too Many Requests) response.
You may know the scenario all too well: Your website is running great; Your real-time analytics show a nice (but not unusual) flow of visitors; and then someone calls out, "Hey, is anyone else seeing timeout errors on the site?" Crap. You flip over to your infrastructure monitoring tools. CPU utilization is fine; the cache servers are up; the load balancers are... dropping servers. At work, we started experiencing this pattern from time-to-time, and the post-mortem log-analysis always showed the same thing: An unusual spike in requests from bots (on the order of 10-20x our normal traffic loads.)
Traffic from bots is a mixed blessing--they're "God's little spiders" without which your site will be unfindable. But entertaining these visitors comes with an infrastructure cost. At a minimum, you're paying for the extra bandwidth they eat; and worst-case, extra hardware (or a more complex architecture) to keep-up with the traffic. For a small business, it's hard to justify buying extra hardware just so the bots can crawl your archives faster; but you can't afford site outages either. What do you do? This is traffic you'd like to keep--there's just too much of it.
My first step was to move from post-mortem to pre-cog. I wanted to see these scenarios playing out in real-time so that I could experiment with different solutions. To do this, I wrote a bot-detecting middleware layer for our application servers (something easily accomplished with Django's middleware hooks.) Once I could identify the traffic, I used statsd and graphite to collect and visualize the data. I now had a way of observing human-traffic patterns in comparison to the bots--and the resulting information was eye-opening.
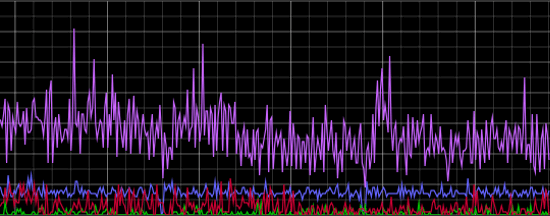
Let's start with a view of normal, site-wide traffic:

In the graph above, the top, purple line plots "total successful server requests" (e.g, 200s, for the web folks.) Below that we see Googlebot in blue, Facebookbot in green, and all other known-bots in red. This isn't what I'd call a high-traffic site, so you'll notice that bots make up almost half of the server requests. [This is, by the way, one of the dangers of only using tools like Chartbeat to gauge traffic--you can gauge content impressions, but you're not seeing the full server load.]
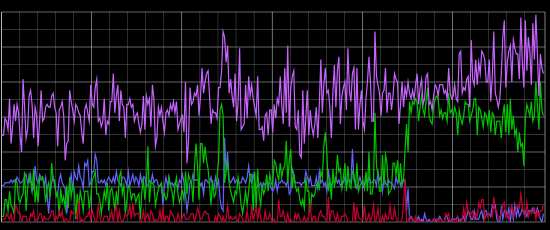
Now let's look at some interesting behavior:

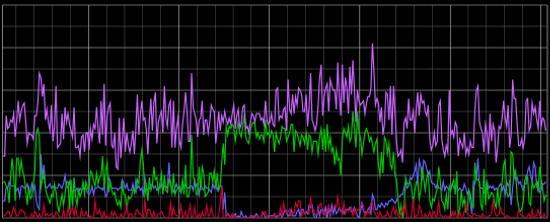
In this graph, we have the same color-coding: Purple plots valid HTTP 200 responses; Blue plots Googlebot; Green plots Facebookbot; and red is all other bots. During the few minutes represented in the far right-hand side of the graph, you might have called the website "sluggish". The bot-behavior during this time is rather interesting. Even though the site is struggling to keep up with the increased requests from Facebookbot, the bot continues hammering the site. It's like repeatedly hitting "reload" in your web browser when you see an HTTP 500 error message response. In comparison, Googlebot notices the site problems and backs-down. Here's a wider view of the same data that shows how Googlebot slowly ramps back up after the incident:

Very well done Google engineers! Thank you for that considerate bot behavior.
With my suspicions confirmed, it was time to act. I could identify the traffic at the application layer, so I knew that I could respond to bots differently if needed. I added a throttling mechanism using memcache to count requests per minute, per bot, per server. [By counting requests/minute at the server-level instead of site-wide, I didn't have to worry about clock-sync; and with round-robin load balancing we get a "good enough" estimate of traffic. By including the bot-name in the cache-key, we can count each bot separately.]
On each bot-request, the middleware checks the counter. If it has exceeded its threshold, the process is hijacked and an HTTP 429 (Too Many Requests) response is returned instead. Let's see how they respond:

Here we see the total count of HTTP 200 responses in green; Googlebot in red; and Facebookbot in purple. At annotation 'A', we see Googlebot making a high number of requests. Annotation 'B' shows our server responding with an HTTP 429. After the HTTP 429 response, Googlebot backs down, waits, and the resumes at it's normal rate. Very nice!
In the same chart (above) we also see Facebookbot making a high number of requests at annotation 'C'. Annotation 'D' shows our HTTP 429 response. After the 429 Facebookbot switches to a spike-pause-repeat pattern. It's odd, but at least it's an acknowledgement, and the pauses are long enough for the web-servers to breathe and handle the load.
While each bot may react differently, we've learned that the big offenders do pay attention to HTTP 429 responses, and will back down. With a little threshold tuning, this simple rate-limiting solution allows the bots to keep crawling content (as long as they're not too greedy) without impacting site responsiveness for paying customers (and without spending more money on servers.) That's a win-win in my book.